Overview
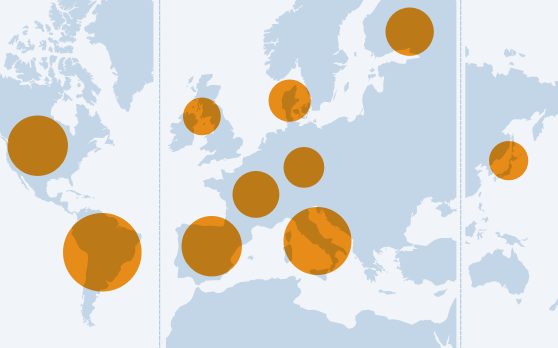
This year's report reveals new insights about digital news consumption based on a YouGov survey of over 18,000 online news consumers in the UK, US, Germany, France, Italy, Spain, Brazil, Japan, Denmark and Finland.
This website contains data about the growth of tablets and smartphones, generational and country based differences in media usage. Also analysis on the role of impartial news in a digital world and the role of social media in finding and distributing news.
Key findings
Introduction
Mobiles and tablets
- The use of smartphones and tablets has jumped significantly in the past year, with fewer people using their computers for news.
- More than a third of online news users across all countries (39%) use two or more digital devices each week for news and a fifth (20%) now say their mobile phone is their primary access point
- Read more on new devices
New disruption
- US social sharing news sites like Huffington Post and Buzzfeed are beginning to make inroads around the world, with new formats and a fresh tone of voice aimed at younger people.
- Even so, traditional brands remain strong in most markets, with cross-platform newspaper reach averaging 75% in most countries.
- Read more on brand performance
Paying for news
- The number of people paying for digital news (11% average) has remained stable over the past 12 months, although we have seen a significant switch to more valuable ongoing digital subscription in most countries.
- Of those paying for news in all countries, 59% are paying for an ongoing subscription (43% 2013). Of those who are not paying, 15% say they are likely to pay in the future
- Read more on online news payment
Social networks
- Our new (and unique) social media index for news shows Facebook is by far the most important network for news everywhere.
- Although Twitter is widely used in the US, Spain, and the UK, it is far less influential in many other European countries. Google+ is emerging as increasingly important for news, along with messaging application WhatsApp.
- Read more on social networks
Interactive
 Explore the data behind the report
Explore the 2014 data and build your own charts. Compare dimensions and data types between or within countries,
About us
The Reuters Institute Digital News Report aims to deliver useful and timely data about the transition to digital. Read more about our annual survey ...
Survey Methodology
The polling was conducted by YouGov in February 2014 using online samples in ten countries. Find out more about the methods involved.
Resources
You can view or download a Powerpoint presentation of all of the charts and tables in the 2014 report.
 Explore the data behind the report


Comment & analysis
Professor Richard Sambrook of Cardiff University asks if traditional journalistic disciplines of objectivity and impartiality are still relevant in a digital news environment.
Robert Picard, Head of Research at the Reuters Institute explores the growing impetus toward paid digital content in print news providers
Gateways and Journeys to the News: UK Case Study
How News and Stories are Followed on Twitter